InvestingIncome correlates to prestige house price, with mining towns the major ABS blow-ins
Income correlates to prestige house price, with mining towns the major ABS blow-ins
Some 20 localities recorded average total incomes of $100,000 plus in 2010-11 across Australia, according to the latest ABS release of ATO data.
But the enduring global financial crisis fallout means many of these well-heeled residents aren’t actually any the wealthier from house price gains given the top end property market still hasn’t recovered.
Of the top 20 income suburbs, 12 were in Sydney, four in Melbourne and four in Perth.
There's no surprise by the strong correlation between the income of the residents and their propensity to pay big money for their city abodes.
The only interesting new trend - or perhaps its retracing steps back to the pioneer days - is the emergence of mining wealth.
Toorak in Melbourne recorded the highest average total income at $150,548 of all the statistical area regions.
Mosman was second at $142,773, then Double Bay-Bellevue Hill at $141,544.
The Hunters Hill-Woolwich peninsula ($138,007) and Cottesloe in western Perth ($125,411) in fifth place.
Outside of the capital city regions, incomes were highest in the mining centres of Karratha ($86,828) and Port Hedland ($86,079) in Western Australia. The coal mining centre of Moranbah ($83,257) in north-east Queensland was also prominent. Singleton ranks highly in NSW regions, along with Roxby Downs in South Australia with incomes rising faster than the wealthiest city locations.
Between 2005-6 and 2010-11, average incomes in Australia grew 4.9% with Western Australia recording the highest levels of income growth.
Sydney's top five income suburbs were....
| 2005/2006 | 2010/11 | Income annual growth % |
$114 971 | $142 773 | 4.4 | |
$114 507 | $141 544 | 4.3 | |
Hunters Hill-Woolwich | $110 865 | $138 007 | 4.5 |
$100 951 | $125 350 | 4.4 | |
$100 871 | $125 091 | 4.4 |
The figure is an aggregate of wages and salaries, investment incomes, businesses, and superannuation.
The data also indicated provided insights into other additional income, including investment income - with Mosman recording an average income of $42,998 from this source in 2010-11. The Double Bay-Bellevue Hill incomes were potentially supplemented by $66,258 from investment income. Hunters Hill incomes were supplemented by $54,678 investment income.
So a quick look at the Sydney median house prices are:
Mosman $2.17 million - down 5.5% over past five years with an average 114 days on market with 9% average discount required to secure a sale.
Double Bay $2.7 million - up 14.6% over past five years with an average 142 days on market with 12% average discount required to secure a sale.
Bellevue Hill $2.88 million - down 14% over past five years with an average 148 days on market with 13% average discount required to secure a sale.
Hunters Hill $1.587 million - up 9% over past five years with an average 94 days on market with 10% average discount required to secure a sale.
Dover Heights $2.4 million - no change over past five years with an average 116 days on market with 11% average discount required to secure a sale.
The Melbourne median house prices are:
Toorak ($150,548) $2.65 million - no change over past five years with an average 160 days on market with 10% average discount required to secure a sale. Toorak was also prominent in investment income terms - recording an average income of $89,841 from this source in 2010-11.
Brighton on the coast of Port Phillip Bay had the second highest average total income in 2010-11 ($111,966). Its $1.69 million house median up 1.6% over past five years with an average 99 days on market with 10% average discount required to secure a sale.
Then followed Albert Park, ($104,168) East Melbourne ($103,268) and Malvern-Glen Iris ($94,697).
Perth's top five were
Cottesloe ($125,411) - $1.725 million down 15% over the past five years 131 days on market with an average 10% discount required to secure a sale.
then Nedlands-Dalkeith-Crawley, ($116,269); Mosman Park-Peppermint Grove, ($116,253); City Beach ($115,829) and Claremont ($99,777).
Port Hedland ($86,079) - $1.2 million median house price up 50% over past five years with an average 101 days on market with 11% average discount required to secure a sale.
Recently RP Data research indicated the top end was at the beginning of renewed price growth after premium housing markets recorded a larger correction in values following the GFC. Cheaper price segments have recorded a higher recovery rate to-date than the prestige home market.
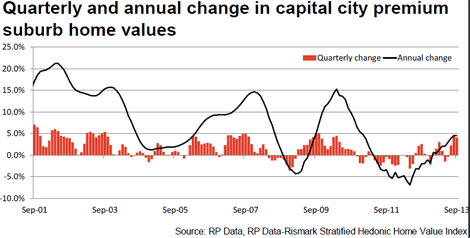
The latest quarterly figures suggest the tide may be turning for Australia’s more expensive housing markets.
The premium market, comprising of the most expensive 25% of capital city suburbs, recorded quarterly value growth of 4.1% compared to 3.6% across the middle 50% of suburbs and 2.8% growth across the most affordable suburbs. It's especially noticeable in Melbourne houses, and also Sydney, but not yet in Brisbane and Adelaide.
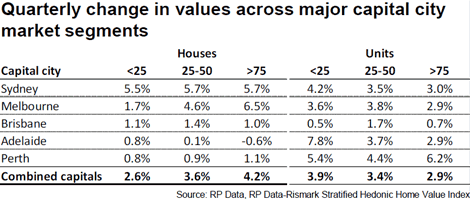
The annual growth in house values is noticeably stronger than unit values. Over the most recent three months, premium house values are 4.2% higher and unit values are 2.9% higher.